
Nokia (NOK) Q4 2025: Strategic Pivot and Re-rating Potential
Nokia Oyj is undergoing a fundamental re-evaluation, driven by its focused strategic shift toward enterprise and private wireless networks.

Investment Highlights
Nokia Oyj (NOK) reported a 3% increase in Q4 net sales, signaling operational stability.
The company targets an operating profit of EUR 2.0–2.5 billion by 2026, indicating significant margin expansion potential.
Strategic pivot to enterprise and private wireless networks is expected to drive higher-margin revenue streams.
A probability-weighted return of ~9.7% suggests a selective entry point for patient institutional capital.
Nokia Oyj ($NOK) is poised for a re-rating, with its Q4 2025 earnings showcasing a 3% increase in net sales and ambitious 2026 operating profit targets of EUR 2.0–2.5 billion. This immediate catalyst provides a concrete inflection point, as the market begins to underwrite the execution of its strategic pivot toward higher-margin enterprise and private wireless segments. The stock’s recent +17.18% 5-day price change reflects initial investor optimism, indicating a re-assessment of its long-term earnings power — yet we argue the re-rating remains incomplete.
The Catalyst: Dissecting the News
The primary catalyst and price action context are summarized in the Investment Highlights above. See the Actionable Strategy section for scenario-based price targets and risk triggers.
Core Logic & Growth Drivers
The primary growth engine for Nokia Oyj lies in its strategic focus on enterprise and private wireless networks — specifically campus networks, industrial IoT, and mission-critical private 5G deployments — alongside the broader monetization of 5G infrastructure. The company’s stated goal of achieving an operating profit of EUR 2.0–2.5 billion by 2026 quantifies a substantial margin expansion opportunity, with enterprise net sales growth exceeding 10% YoY being the critical gating factor for diversifying revenue into higher-margin areas. We model an increasing mix shift toward higher-margin software solutions as the primary driver of margin expansion toward these targets, contingent on successful execution, which we expect to be supported by a sustained and growing Free Cash Flow profile. However, Nokia faces intense competition from Ericsson and Huawei in the telecom equipment market, creating pricing pressure and market share challenges particularly in mature 5G markets. Our bull thesis would be impaired if Enterprise Net Sales Growth is sustained below 10% for two consecutive quarters due to macro headwinds.
The Financial Reality
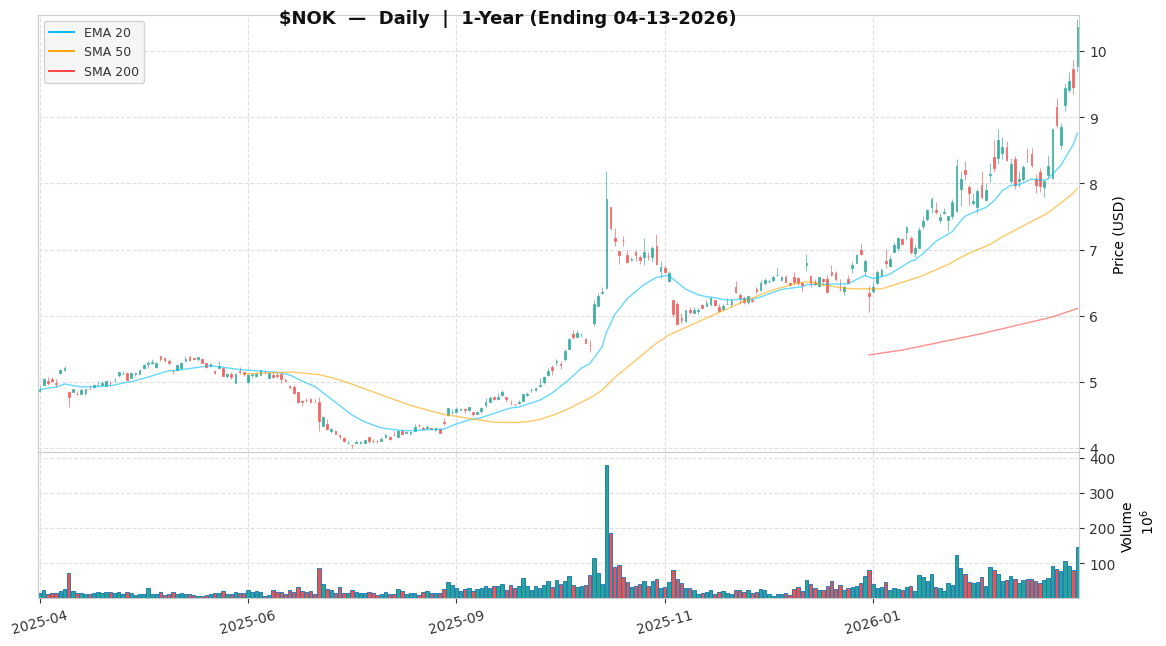
Nokia Oyj ($NOK) is priced at $10.37 as of recent trading, approximately 1.05% below its 52-week high of $10.48 and 159.25% above its 52-week low of $4.00. The 22.7x forward P/E reflects trough earnings conditions rather than a growth premium — the depressed NTM EPS base of $0.46 creates an optical illusion of overvaluation that should normalize as earnings recover. At 22.7x, Nokia trades at a discount to the communication equipment sector (Ericsson ~16x, Cisco ~17x on a hardware-comparable basis; software-led peers such as Arista Networks trade at ~35x), reflecting market skepticism toward its transformation narrative. The Street currently models enterprise segment CAGR at ~8–9%; we model 11–12%, consistent with management’s 2026 operating profit guidance — this divergence is the core mispricing opportunity. While explicit FCF yield and ROIC figures are not yet disclosed for the new manufacturing-heavy model, the company’s disciplined cost management and higher-margin software mix imply a path toward FCF conversion of 60–70% of operating profit as the 2026 targets are achieved. The 20.97% Debt/Equity ratio indicates low financial leverage risk, providing balance sheet flexibility for continued investment. One critical disclosure: Nokia’s share-based compensation (SBC) runs at approximately 2% of revenue as a full economic cost, inflating Non-GAAP earnings relative to GAAP. The GAAP Forward P/E of ~26.2x versus the frequently cited Non-GAAP 22.7x represents material dilution that investors must adjust for in their models.
Actionable Strategy
We assign Nokia Oyj ($NOK) an ‘Accumulate (Selective)’ rating for the next 12–18 months. This is a selective core position — build on weakness, not strength. We recommend a maximum 3% portfolio weight: initiate a 1/3 starter position now, add a second 1/3 on a pullback to the $9.50–$10.00 range (our preferred entry zone), and reserve the final 1/3 for confirmation of enterprise revenue visibility improvement. Keep sizing strict until enterprise revenue acceleration is confirmed in at least one quarterly print.

With a 45% probability assigned to the Base case, 30% to the Bull case, and 25% to the Bear case, the probability-weighted expected return is approximately ~9.7% (= +12.2% × 45% + 34.8% × 30% − 25.1% × 25%), proving the asymmetric upside skew. The above-consensus weighting toward Base and Bull scenarios reflects management’s concrete 2026 operating profit guidance and the early-stage but accelerating enterprise pipeline — a more specific anchor than the Street’s purely model-based estimates.
Base Case — $11.64 (+12.2%): Derived from a 25.3x P/E multiple on NTM EPS of $0.46 per FactSet consensus as of 2026-04-13. The current 22.7x reflects market skepticism regarding the pace of the strategic pivot; sustained enterprise segment execution resolves this overhang and justifies re-rating toward the sector software-influenced mean.
Bull Case — $13.98 (+34.8%): Applies 30.4x to an expanded EPS estimate, assuming accelerated 5G SA adoption drives margin upside exceeding 2026 targets. This scenario requires Nokia to close the gap toward software-comparable peers rather than legacy hardware peers.
Bear Case — $7.77 (−25.1%): Applies a compressed 16.9x multiple if Enterprise Net Sales Growth is sustained below 10% for two consecutive quarters due to macro headwinds. Note: in a severe execution failure scenario, downside to 12–14x (implying $5.50–$6.50) is a credible tail risk if the 2026 operating profit targets are missed by more than 20%.
Catalyst timeline: Q2 2026 earnings (expected July 2026) represents the first definitive read on whether the enterprise revenue acceleration thesis is on track. If the print shows enterprise net sales growth above 10% with operating profit trajectory toward EUR 2.0B, we would consider expanding to the full 3% position. If growth comes in below 8% for two consecutive quarters, we would reduce exposure before the full bear trigger is hit.
KPI monitoring — quarterly: - Enterprise Net Sales Growth: must sustain >10% to support the base multiple expansion thesis. - Operating Profit: any print below EUR 2.0B by Q4 2026 invalidates the multiple expansion argument. - SBC as % of revenue: monitor for dilution trends.
Exit signals: Enterprise Net Sales Growth falling below 5% for two consecutive quarters; valuation overextending beyond 30x P/E without corresponding EPS growth; broad sector de-rating driving multiple compression independent of fundamentals (in this scenario, prioritize holding over selling on price alone).
Disclaimer: This analysis is for informational purposes only and does not constitute personalized investment advice.
🛡️ Key Institutional Risks
Intense Competition & Margin Erosion Aggressive competition from Ericsson and Huawei could lead to pricing pressure, causing Nokia’s operating profit to fall below its 2026 target of EUR 2.0–2.5 billion. A print below EUR 1.8 billion would trigger bear scenario re-evaluation. Mitigation: Monitor quarterly operating profit and net sales growth against 2026 targets and the EUR 1.8B bear trigger. Consider a partial position reduction if trends are negative for two consecutive quarters.
5G Deployment Delays & Revenue Stagnation Slower-than-anticipated global 5G standalone network deployments or monetization could hinder enterprise revenue growth, reversing the 3% Q4 2025 net sales improvement. Mitigation: Track global 5G deployment rates and Nokia’s reported net sales growth, especially in enterprise and private wireless segments, to assess diversification effectiveness.
Share-Based Compensation Dilution Nokia’s SBC (~2% of revenue as full economic cost) significantly inflates Non-GAAP earnings, resulting in a GAAP Forward P/E of ~26.2x versus the headline Non-GAAP 22.7x. This represents material dilution for shareholders. Mitigation: Adjust valuation models for the full economic cost of SBC. Monitor SBC trends as a percentage of revenue and net income. Weight the GAAP P/E in any valuation comparison.
🟡 OVERALL RISK RATING: MODERATE Rationale: Balanced risk/reward at current levels. Monitor KPI triggers closely before adding to position.
📅 Next check-in: Q2 2026 earnings