
Lucid Group: Q1 2026 Earnings and Persistent Liquidity Challenges
A critical financial re-evaluation of Lucid Group's operational ramp and urgent capital needs ahead of Q1 2026 results.


Investment Highlights
Cash Runway: Approximately 2.2 quarters at current burn rate ($733M/quarter).
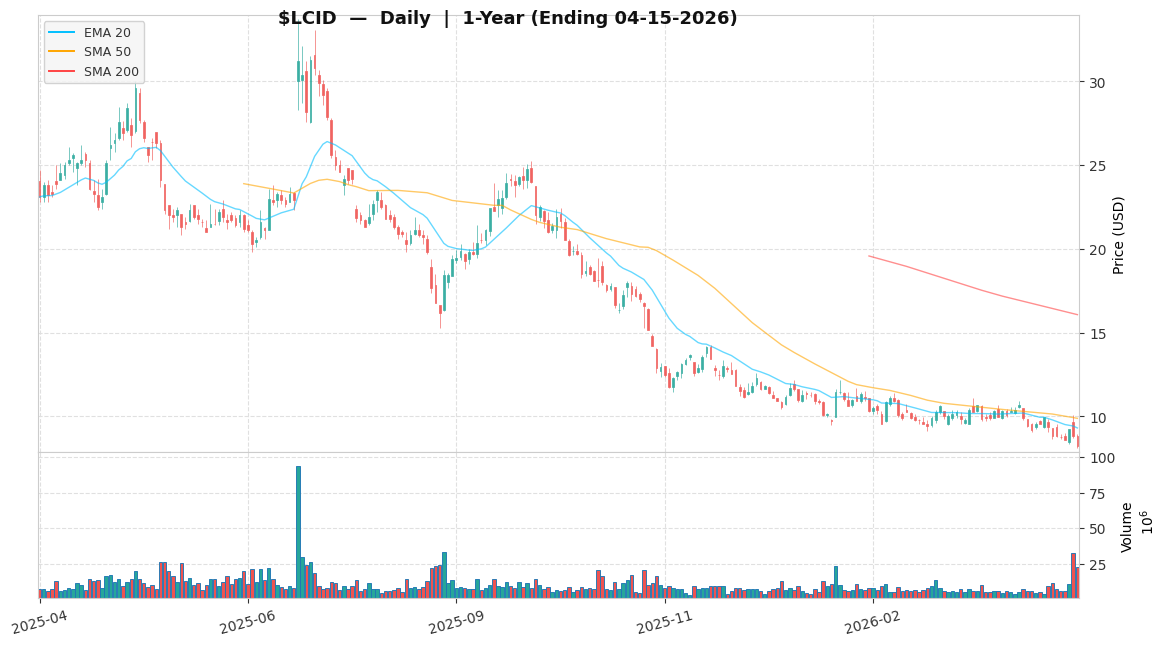
Price Action: Currently $8.21, down 66.6% from its 52-week high of $24.63.
Probability-Weighted Return: ~42.3% upside potential under scenario-based assumptions.
Baseline Metrics & KPI Targets: Current TTM Gross Margin sits deep in negative territory at approximately -162% (Q4 2025: -155%, Q3 2025: -170%). Quarterly Vehicle Deliveries need to consistently exceed 5,000 units to validate growth and map a path to positive unit economics.
Lucid Group, Inc. ($LCID) is navigating a critical juncture, with its Q1 2026 earnings call on May 5, 2026, serving as the immediate catalyst to demonstrate tangible progress in production ramp-up and initial demand signals for the Air models. The market acutely awaits concrete updates on the Gravity SUV’s commercialization timeline. The stock’s -66.6% drawdown reflects persistent production bottlenecks, high cash burn, and intense competition, creating a potential entry point for patient institutional capital that can underwrite the execution risk.
The Catalyst: Dissecting the News
The primary catalyst and price action context are summarized in the Investment Highlights above. See the Actionable Strategy section for scenario-based price targets and risk triggers.
Core Logic & Growth Drivers
The core growth thesis for Lucid Group ($LCID) centers on its ability to establish a dominant position in the ultra-luxury EV segment with its Air sedan, and critically, to successfully launch and scale the Gravity SUV. Consensus models the Gravity as the primary volume driver for future quarters. While Air model deliveries are slowly ramping, Gravity SUV monetization remains a near-term growth catalyst. We estimate the Gravity SUV still represents only a low-single-digit percentage of total revenue at this stage; therefore, the investment thesis is fundamentally about a multiple re-rating based on operational execution rather than a near-term earnings explosion.
However, achieving this execution requires navigating severe capital constraints. Lucid’s substantial R&D investments, particularly for the Gravity platform, drive significant CapEx that will remain elevated as a percentage of revenue. While critical for long-term viability, these investments create a massive near-term drag on Free Cash Flow. EPS inflection is highly sensitive to accelerated revenue growth and aggressive cost efficiencies. The speculative thesis is significantly impaired if quarterly cash burn exceeds $733M for two consecutive quarters, signaling an accelerated liquidity crisis—though this risk is somewhat mitigated by historical backing from the Saudi Public Investment Fund (PIF), which remains the ultimate, albeit dilutive, liquidity backstop.
Further complicating the ramp-up are shifting macro conditions and fierce competition. Lucid faces intense pressure from established luxury players like Porsche (Taycan) and Mercedes-Benz (EQS), who possess deeper distribution networks, mature pricing power, and superior economies of scale. High interest rates continue to pressure premium auto financing, dampening broader EV demand. Consequently, production ramp execution is a binary risk: delays or quality issues will materially derail the revenue trajectory, exacerbating ongoing shareholder dilution from the continuous capital raises required to bridge the gap to profitability.
The Financial Reality
Lucid Group is priced at $8.21, approximately 66.6% below its 52-week high of $24.63. Valuing early-stage, pre-profit automakers via Price-to-Earnings (P/E) is analytically unhelpful; benchmarking LCID’s negative earnings against the positive multiples of legacy, highly profitable luxury EV peers creates a false equivalency. Instead, valuation must be grounded in Price-to-Sales (P/S) and EV/Sales metrics. LCID currently trades at a compressed forward P/S multiple, reflecting the market’s skepticism regarding its cash burn and the transformation narrative.
Crucially, with Stock-Based Compensation (SBC) at 20.0% of revenue, reported Non-GAAP EPS materially understates true economic costs. For intrinsic value purposes, we model SBC as a full economic cost on GAAP FCF. Lucid holds approximately $1,628.9M in cash, burning ~$733.0M per quarter, implying roughly 2.2 quarters of runway before additional capital is required. The 106.53% Debt/Equity ratio signals elevated financial leverage, highlighting the persistent dilution risk as the company likely taps equity markets or convertible debt to fund operations through 2026.
Actionable Strategy
Decision priority: Quarterly Vehicle Deliveries and Gross Margin are the metrics that drive actual portfolio action. Cash Runway is an early-warning signal—important context, not a primary exit trigger.
| Trigger Level | Primary KPI Threshold | Action | |---|---|---| | Bull Thesis Impairment | Quarterly Vehicle Deliveries below 5,000 units for 2 consecutive quarters; Gross Margin remains negative for 2 consecutive quarters; Cash Runway falls below 3 quarters for 2 consecutive quarters | Re-evaluate bull case; no new adds | | Position Reduction | Quarterly Vehicle Deliveries below 4,000 units for 2 consecutive quarters; Gross Margin shows no year-over-year improvement for 3 consecutive quarters; Cash Runway falls below 2.5 quarters for 2 consecutive quarters | Trim to 1% portfolio weight | | Full Exit | Quarterly Vehicle Deliveries below 3,000 units for 2 consecutive quarters; Gross Margin degrades further for 4 consecutive quarters; Cash Runway falls below 2.2 quarters for 2 consecutive quarters | Exit; thesis invalidated |
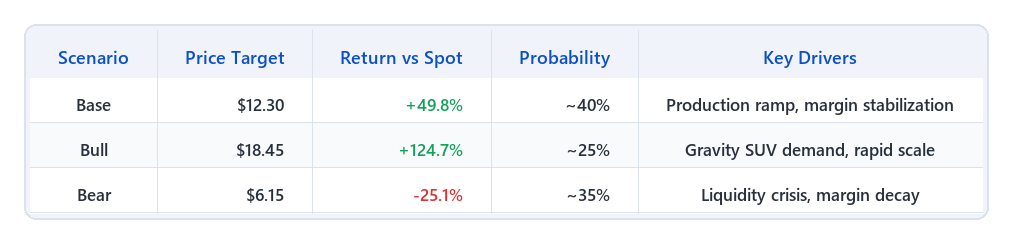
We assign Lucid Group, Inc. ($LCID) a ‘Speculative Buy’ rating for the next 12-18 months. We are sizing this as a small, satellite position (max 1-2% of portfolio) given binary execution risk—entry should be staged across 3 tranches. With a 40% probability assigned to the Base case, 25% to the Bull case, and 35% to the Bear case, the probability-weighted expected return (PWR) is approximately ~42.3% (= +49.8% × 40% + 124.7% × 25% − 25.1% × 35%).
Our Base Case target is $12.30, derived from a 3.0x P/S multiple on TTM Revenue per Share of $4.1006 (as of 2026-04-15), representing a +49.8% move. A consistent ramp in quarterly deliveries above 5,000 units and tangible progress towards positive gross margins would resolve the current market overhang, justifying a re-rating toward this 3.0x median for early-stage growth OEMs.
Our Bull Case target is $18.45, applying 4.5x to an expanded Revenue per Share estimate, suggesting a +124.7% move. This reflects the re-rating potential if the company demonstrates sustained gross margin improvement, strong Gravity SUV adoption, and revenue acceleration.
Our Bear Case target is $6.15, applying a compressed 1.5x multiple, indicating a -25.1% downside. This reflects distressed EV sector valuations in a scenario of persistent cash burn (>$733M/qtr) and an accelerated liquidity crisis without timely PIF intervention.
One tail risk worth flagging: a broad sector-level de-rating of Auto Manufacturers—driven by macro regime shifts or investor rotation—could compress LCID’s multiple independent of its fundamental progress. In a broad sector de-rating, we would prioritize HOLDING; however, strong fundamental exit triggers (deliveries <3,000 or runway <2.2 quarters) mandate a definitive exit. Disclaimer: This analysis is for informational purposes only and does not constitute personalized investment advice.
🛡️ Key Institutional Risks
Critical Liquidity Shortfall & Dilution LCID’s operating cash burn of ~$733M per quarter against a 2.2-quarter runway poses an immediate solvency threat. While PIF backing is a structural advantage, reliance on external capital with a high Debt/Equity ratio (106.5%) and high SBC (20% of revenue) guarantees severe equity dilution. MITIGATION: Cap position size. Establish a hard stop if cash runway falls below 1.5 quarters without a firm funding commitment, or if new equity raises occur at a >15% discount to market price.
Inadequate Production & Demand Scaling Failure to scale luxury EV volumes against legacy competitors (Porsche, Mercedes), evidenced by declining YoY revenue or sustained Gross Margins below -150%, indicates a breakdown in market acceptance and unit economics. MITIGATION: Monitor quarterly delivery reports strictly. Exit if YoY revenue growth turns negative for two consecutive quarters, or if gross margins fail to show a clear upward trajectory by Q4 2026.
🟡 OVERALL RISK RATING: MODERATE to HIGH Rationale: Asymmetric upside, but binary execution risk. Monitor KPI triggers closely before adding.
📅 Next check-in: Q2 2026 earnings