
INTC's Strategic Crossroads: AI & Foundry Execution Under Scrutiny
Intel Corporation faces a critical re-evaluation as its AI strategy and foundry scaling determine if its current valuation premium is sustainable.


Investment Highlights
Intel Corporation ($INTC) Q1 2026 non-GAAP EPS of $0.29 significantly beat guidance by $0.28.
Q1 revenue of $13.6 billion exceeded guidance by $1.4 billion, demonstrating strong execution.
Non-GAAP gross margin of 41% was 650 basis points above internal expectations, signaling improving profitability.
Data Center & AI (DCAI) segment revenue reached $5.1 billion, up 22% year-over-year — ahead of internal expectations.
External Foundry Services (IFS) revenue reached $174 million, a critical early indicator for the IDM 2.0 strategy.
⚠️ GAAP reality check: Q1 2026 GAAP net loss was approximately $3.7 billion, adjusted free cash flow was negative $2.0 billion, and restructuring/impairment charges totaled $4.1 billion — cash burn remains a primary risk to monitor.
The Catalyst: Dissecting the News
Intel Corporation ($INTC) delivered a strong Q1 2026 earnings beat on a non-GAAP basis, with EPS of $0.29 significantly surpassing guidance and revenue of $13.6 billion exceeding expectations by $1.4 billion. This performance, coupled with a non-GAAP gross margin of 41% (650 basis points above guidance), acts as an immediate catalyst forcing a re-evaluation of the market’s conservative stance on the company’s strategic turnaround. However, investors must hold both realities simultaneously: behind the non-GAAP outperformance lies a GAAP net loss of approximately $3.7 billion and negative adjusted free cash flow of $2.0 billion, driven in part by $4.1 billion in restructuring and impairment charges. While the 74.35x forward P/E reflects some optimism, we believe the Street is under-modeling the near-term velocity of AI-driven CPU demand and the early traction in its foundry business — creating earnings surprise potential for Q2 2026 if management sustains or improves its 39% non-GAAP gross margin guidance. The stock’s +26.56% surge over the last 5 days indicates a positive, albeit cautious, re-rating by the market, yet it remains just 2.43% below its 52-week high, suggesting a more sustained rally is contingent on continued execution.
Core Logic & Growth Drivers
Intel’s core growth thesis anchors on its strategic IDM 2.0 initiative, aiming to reclaim process technology leadership and significantly expand its Intel Foundry Services (IFS) while capitalizing on the burgeoning AI-driven CPU market. The DCAI segment’s 22% year-over-year revenue growth to $5.1 billion in Q1 2026 establishes a higher baseline than initially modeled, and our risk thresholds have been recalibrated accordingly. The company’s Q1 external foundry revenue of $174 million represents a meaningful early-stage monetization vector, but the full picture demands transparency: the IFS segment generated an operating loss of approximately $2.4 billion in Q1 alone. This cash drain from scaling advanced process nodes is the primary headwind to the bull thesis, and the path to foundry profitability remains a multi-year endeavor. We estimate IFS still represents a low-single-digit percentage of total revenue at this stage, acting as a catalyst for re-rating rather than the primary earnings driver for the current fiscal year.
This strategic pivot necessitates substantial capital expenditures, with Intel defending these investments through projected free cash flow generation and a long-term goal of 60% gross margins, though near-term CapEx will continue to be a drag on GAAP profitability. Intel faces intense competitive pressure from specialized AI accelerators like Nvidia’s H100/H200 and traditional CPU rivals such as AMD’s MI300X, alongside ARM-based solutions gaining traction in data centers. Furthermore, Taiwan Semiconductor Manufacturing Company (TSMC) poses a dual-layer competitive challenge: as the world’s leading foundry, TSMC’s pricing power and technology leadership define the ceiling on IFS’s addressable opportunity, while simultaneously serving as a potential future customer. The thesis would be materially impaired if DCAI Revenue Growth is sustained below 10% for two consecutive quarters — a threshold raised from the prior 5% floor to better reflect the segment’s demonstrated Q1 velocity.
The Financial Reality
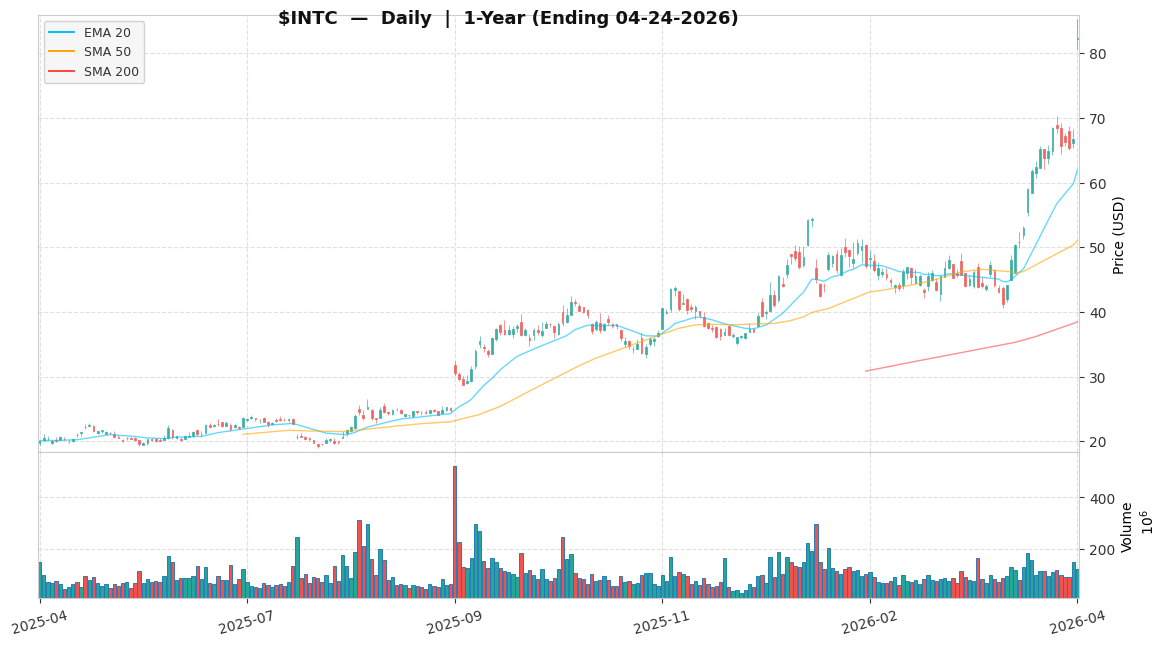
Intel Corporation ($INTC) is priced at $83.15 as of recent trading, approximately 2.43% below its 52-week high of $85.22 and 299.9% above its 52-week low of $20.79.
A note on the valuation framework: The 74.35x forward P/E multiples used throughout this analysis are best interpreted as transitional-cycle multiples, not sustainable steady-state valuations. Applying P/E to a near-zero GAAP earnings company is inherently unstable — a small earnings miss can cause the implied multiple to swing dramatically. EV/EBITDA or a DCF anchored to FCF recovery would be more methodologically robust; we use P/E here for comparability with consensus estimates and historical precedent, while acknowledging its limitations at this stage of Intel’s cycle.
The elevated 74.35x forward P/E reflects trough earnings conditions rather than a growth premium, as the depressed EPS base creates an optical illusion of overvaluation that should normalize as earnings recover. This multiple trades at a significant premium to legacy semiconductor peers (often 15-25x) but a discount to hyper-growth AI pure-plays, reflecting the market’s mixed view on Intel’s transformation narrative. Historically, INTC traded at 10-15x P/E during cyclical troughs (e.g., 2022), normalized to 18-25x, and peaked above 30x in prior growth cycles.
GAAP vs. Non-GAAP EPS Bridge:
| Basis | NTM EPS | Implied Forward P/E | Notes | |---|---|---|---| | Non-GAAP (consensus) | ~$1.12 | 74.35x | Primary scenario basis | | GAAP-adjusted (incl. ~5% SBC) | ~$0.63 | ~131.1x | Full economic cost basis | | Bear Extreme (margin compression) | ~$0.85 | 55.7x (bear target) | Adj. op. margin ~30–35% |
The GAAP-adjusted NTM EPS of ~$0.63 implies a forward P/E of ~131.1x — approximately 1.76x the reported non-GAAP multiple. For intrinsic value purposes, we model SBC as a full economic cost on GAAP FCF. Intel’s heavy CapEx cycle implies a multi-year investment recovery timeline for its IDM 2.0 strategy, creating a near-term FCF drag not fully captured by the P/E. Debt/Equity ratio stands at 37.28%, indicating moderate financial leverage, manageable for a company of this scale per Intel Corporation FY2025 10-K.
Actionable Strategy
NTM EPS from FactSet consensus as of 2026-04-24.
We assign Intel Corporation ($INTC) an ‘Accumulate (Selective)’ rating for the next 12–18 months, viewing it as a selective core position to build on weakness, not strength — recommending a maximum 3% portfolio weight, with initial capital deployed now and subsequent tranches on pullbacks to the $70–$75 range.
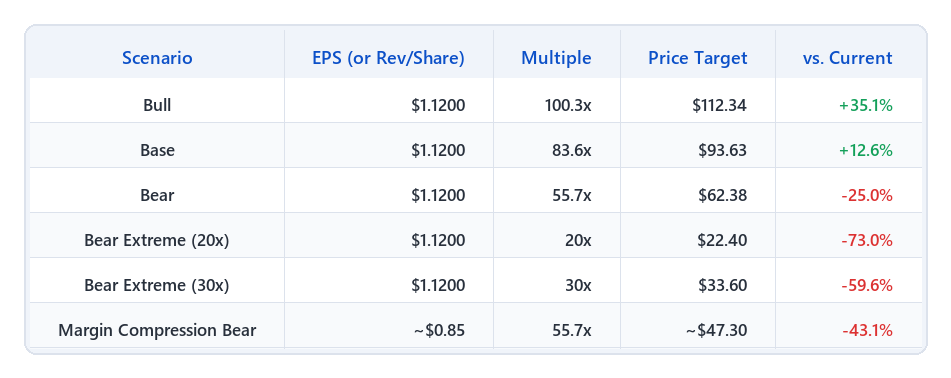
On the PWR vs. rating tension: With a 40% Base, 25% Bull, and 35% Bear probability, the probability-weighted expected return is approximately ~5.1% (= +12.6% × 40% + 35.1% × 25% − 25.0% × 35%). We acknowledge the asymmetric skew explicitly: the bear scenario (35% probability, -25% return) generates a greater expected loss magnitude than the base case upside (+12.6%), and the overall PWR falls below the typical 8–12% institutional hurdle rate. The ‘Selective’ and 3% cap rating is sustained not by the mean return alone, but by the non-linear re-rating potential embedded in the bull scenario: if IDM 2.0 execution surprises to the upside, the +35.1% return in a 25% probability outcome contributes outsized portfolio value relative to its weight. Investors who cannot tolerate the full bear range ($22.40 to $62.38) should avoid this position entirely.
Our Base Case target of $93.63 reflects a justified re-rating to an 83.6x P/E multiple as IDM 2.0 execution concerns subside and AI CPU traction builds. The Bull Case target of $112.34 (100.3x P/E) anticipates sustained gross margin expansion above 45% and DCAI Revenue Growth exceeding 15% Y/Y. Conversely, the Bear Case target of $62.38 (55.7x P/E) materializes if DCAI Revenue Growth is sustained below 10% for two consecutive quarters, warranting position re-evaluation.
The 55.7x–100.3x scenario band broadly reflects the trough-to-peak P/E range observed across semiconductor companies at comparable turnaround stages, with the base 83.6x sitting near the sector median for companies demonstrating early signs of gross margin recovery. As the EPS denominator normalizes from trough levels, multiple compression from 80x+ toward 20–30x is expected — the bull thesis requires gross margin and earnings recovery to outpace that multiple compression.
Decision priority: DCAI Revenue Growth and Non-GAAP Gross Margin are the metrics that drive actual portfolio action. IFS External Revenue is an early-warning signal — important context, not a primary exit trigger.
| Trigger Level | Primary KPI Threshold | Action | |---|---|---| | Bull Thesis Impairment | DCAI Revenue Growth below 15% for 2 consecutive quarters | Re-evaluate bull case; no new adds | | Position Reduction | DCAI Revenue Growth below 10% for 2 consecutive quarters | Trim to 1.5% portfolio weight | | Full Exit | DCAI Revenue Growth below 5% for 2 consecutive quarters | Exit; thesis invalidated | | Margin Impairment | Non-GAAP Gross Margin below 38% for 2 consecutive quarters | Re-evaluate margin thesis; no new adds | | SBC Escalation | SBC as % of revenue increases QoQ for 2 consecutive quarters | Flag as valuation risk multiplier; review position size |
Note: DCAI growth thresholds have been raised from prior levels to reflect the segment’s demonstrated Q1 2026 velocity of 22% Y/Y. The prior 5% exit threshold is now the absolute floor for thesis invalidation.
Our Bear Extreme sub-scenario illustrates a full de-rating to trough multiples: at 20x P/E on NTM EPS of $1.12, the price target is $22.40 (-73.0% downside); at 30x P/E, the target is $33.60 (-59.6% downside). This range has historical precedent, as INTC traded at 10-15x P/E during the 2022 tech de-rating. A margin compression scenario, where adjusted operating margin falls to ~30-35% (vs. guided target >45%), could reduce NTM EPS to approximately ~$0.85, implying a bear target of ~$47.30 at 55.7x — achievable without any multiple compression, purely from earnings disappointment.
One tail risk worth flagging: a broad sector-level de-rating of Technology — driven by macro regime shifts, policy headwinds, or investor rotation — could compress INTC’s multiple independent of its fundamental progress. At 74x forward P/E, Intel is highly duration-sensitive; a scenario where interest rates remain elevated longer than expected would compress this multiple significantly even without any deterioration in fundamentals. In a broad sector de-rating scenario, we would prioritize HOLDING; however, strong exit triggers include DCAI Revenue Growth falling below 5%, Non-GAAP Gross Margin consistently below 38%, or valuation overextending beyond 100x P/E without corresponding EPS growth.
Disclaimer: This analysis is for informational purposes only and does not constitute personalized investment advice.
🛡️ Key Institutional Risks
Foundry Execution & Margin Pressure Intel’s IDM 2.0 strategy, particularly the foundry business, faces significant execution risk. The IFS segment posted an operating loss of approximately $2.4 billion in Q1 2026 — the cash drain of scaling advanced nodes is the primary headwind to the bull thesis. Delays, lower yields, or insufficient external customer adoption could cause non-GAAP gross margins to fall below the Q2 guidance of 39%, potentially dropping below 35%. TSMC’s pricing power and technology leadership define the ceiling on IFS’s addressable opportunity and must be tracked as a competitive reference point. MITIGATION: Monitor IFS revenue growth, operating loss trajectory, and non-GAAP gross margin trends. If non-GAAP gross margin consistently falls below 35%, consider reducing position size or hedging against manufacturing underperformance.
AI Market Share & Growth Lag Intel’s ability to capture the AI inference market is critical. DCAI grew 22% Y/Y to $5.1B in Q1 2026, establishing a strong baseline. Failure to sustain this trajectory against specialized accelerators and CPU competitors could result in DCAI revenue growth falling below 10% year-over-year. MITIGATION: Closely track DCAI segment revenue growth and market share against the recalibrated thresholds above. If year-over-year growth consistently falls below 10%, trim to 1.5% portfolio weight; below 5%, exit.
Sustained GAAP Unprofitability & Cash Burn Intel’s Q1 2026 GAAP net loss was approximately $3.7 billion, and adjusted free cash flow was negative $2.0 billion. High share-based compensation (4.6% of revenue), $4.1 billion in restructuring/impairment charges, and significant CapEx create substantial cash burn that institutional investors will scrutinize closely. MITIGATION: Monitor GAAP net income, free cash flow, and restructuring charge trajectory for a sustained positive trend. If Intel fails to achieve positive GAAP net income and free cash flow within the next 4–6 quarters, or if SBC as a percentage of revenue rises above 7%, consider reducing exposure.
Geopolitical & Export Control Risk (New) Intel’s business has material exposure to U.S.–China semiconductor policy risk, including CHIPS Act funding dependencies, export restrictions on advanced chips and equipment, and potential retaliatory trade measures. Over a 12–18 month holding horizon, policy shifts — including changes to CHIPS Act disbursements or tightening of export controls — could directly impact Intel’s foundry ramp timeline and data center revenue in China-exposed markets. MITIGATION: Track U.S. Commerce Department export rule updates and CHIPS Act funding disbursement milestones. Any credible threat to CHIPS Act funding or broad export control tightening affecting Intel’s advanced node business should trigger a position size review.
🔴 OVERALL RISK RATING: HIGH Rationale: Forward P/E > 50x on near-zero GAAP earnings creates significant multiple instability. GAAP net loss of ~$3.7B and negative FCF in Q1 2026 represent real cash burn, not accounting artifacts. Binary growth thesis with asymmetric return skew (bear probability 35% at -25% vs. base 40% at +12.6%). Strict position sizing (≤3% portfolio weight) is mandatory.
📅 Next check-in: Q2 2026 earnings