
Ethereum: On-Chain Data Signals Generational Buy Zone
On-chain metrics indicate Ethereum USD ($ETH) has entered a historically significant accumulation zone, preceding substantial structural bull rallies.


Investment Highlights
Ethereum MVRV Ratio has dropped into the 0.8–1.0 “Buy Zone.”
Historically, this MVRV range preceded gains from +150% to over +5,390% (based on 3 prior market cycles between 2015 and 2021).
We suggest ETH is nearing a long-term bottom for 12-24 month accumulation, but sizing must reflect extreme historical drawdowns exceeding -75%.
The Catalyst: Dissecting the News
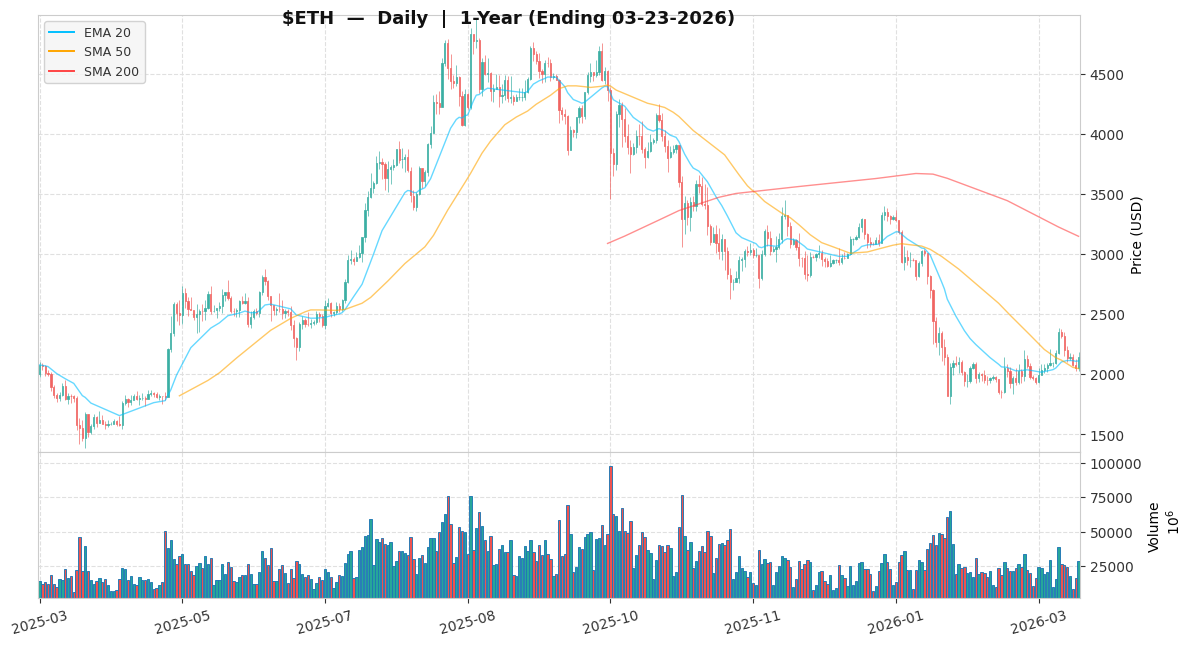
The primary catalyst for Ethereum USD ($ETH) stems from on-chain analysis by Ali Martinez, who pinpointed its Market Value to Realized Value (MVRV) Ratio entering the 0.8–1.0 range, a zone historically signaling a generational ‘Buy Zone’ and a precursor to massive structural bull rallies. The digital asset’s significant -56.7% drawdown from its 52-week high reflects a prolonged bear market and deleveraging across the broader crypto landscape, creating a compelling accumulation opportunity for patient on-chain-first capital.
Core Logic & Growth Drivers
The core growth thesis for Ethereum ($ETH) is anchored in its continued dominance as the leading smart contract platform, driving substantial protocol revenue through network fees and decentralized finance (DeFi) activity. Operating as the foundational layer for Web3, Ethereum benefits from the expansion of its Layer 2 scaling solutions, which enhance transaction throughput and lower costs, thereby attracting a broader developer and user base. The ongoing transition of traditional financial assets on-chain (tokenization) represents a massive total addressable market, further solidifying Ethereum’s utility and long-term value proposition within the broader digital asset ecosystem.
Financial Reality
Ethereum USD ($ETH) is currently trading at $2147.80, significantly lower than its 52-week high of $4092.00, reflecting the severity of the recent market correction. As a decentralized protocol, traditional equity valuation metrics such as Forward P/E or Debt/Equity are fundamentally not applicable. Instead, network value is assessed through on-chain metrics; the MVRV ratio currently indicates that the asset is undervalued relative to its realized capitalization. Furthermore, the network generates substantial protocol revenue via transaction fees, distinguishing it from non-yielding digital assets and providing a quantifiable basis for its economic model.
Actionable Strategy
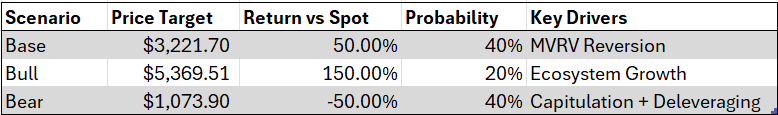
We are assigning a ‘Speculative Buy’ rating to Ethereum USD ($ETH) over a 12-18 month horizon. This represents a high-risk, early-stage digital asset investment, and position sizing must reflect the scenario-based nature of the targets. Utilizing dynamic probability weightings of 40% for the Base case, 20% for the Bull case, and 40% for the Bear case, our Probability-Weighted Return (PWR) is approximately ~30.0% (= +50.0% × 0.40 + 150.0% × 0.20 − 50.0% × 0.40). Immediately following this expected return, we must contextualize this against historical maximum drawdowns exceeding -75% in prior cycles, underscoring the extreme volatility of this asset class.
Our Base Case target is $3,221.70, representing a +50.0% upside scenario. This target is informed by historical MVRV ratio reversions from the ‘Buy Zone’ which have consistently yielded significant double-digit returns. Our Bull Case target is $5,369.51 (+150.0% upside), unlocked by a resurgence in broader crypto market liquidity. Our Bear Case target is $1,073.90 (-50.0% downside) if on-chain data shows a sustained breach of the MVRV Ratio below 0.8 alongside stablecoin market capitalization contraction.
Position Sizing & KPI Rules: For a diversified multi-asset portfolio, we recommend sizing this as a low-to-mid single-digit percentage allocation. If Ethereum’s Total Value Locked (TVL) grows >15% QoQ alongside aggregate stablecoin expansion, we will scale up the position by 25%. Compliance Note: While currently in a ‘generational buy zone’, on-chain signals do not guarantee future performance and may fail under structural regime shifts, such as severe regulatory crackdowns or technological obsolescence.
Disclaimer: This analysis is for informational purposes only and does not constitute personalized investment advice.