
ASTS Stock Price Prediction 2026: Satellite-to-Cell Outlook

The Catalyst: Dissecting the News
ASTS dropped 5.3% in the last 24 hours. There are two primary reasons for this contraction. First, the loss of the BlueBird 7 satellite during the Blue Origin New Glenn 3 mission on Sunday has introduced a significant delay in the company’s operational timeline. This failure directly impacts the Launch Cadence—the frequency at which a company successfully places hardware into orbit—which is currently the most critical metric for achieving global coverage and cash-flow breakeven. The market had priced in a flawless execution of the New Glenn flight; the resulting loss necessitates a reassessment of the 2026 revenue ramp.
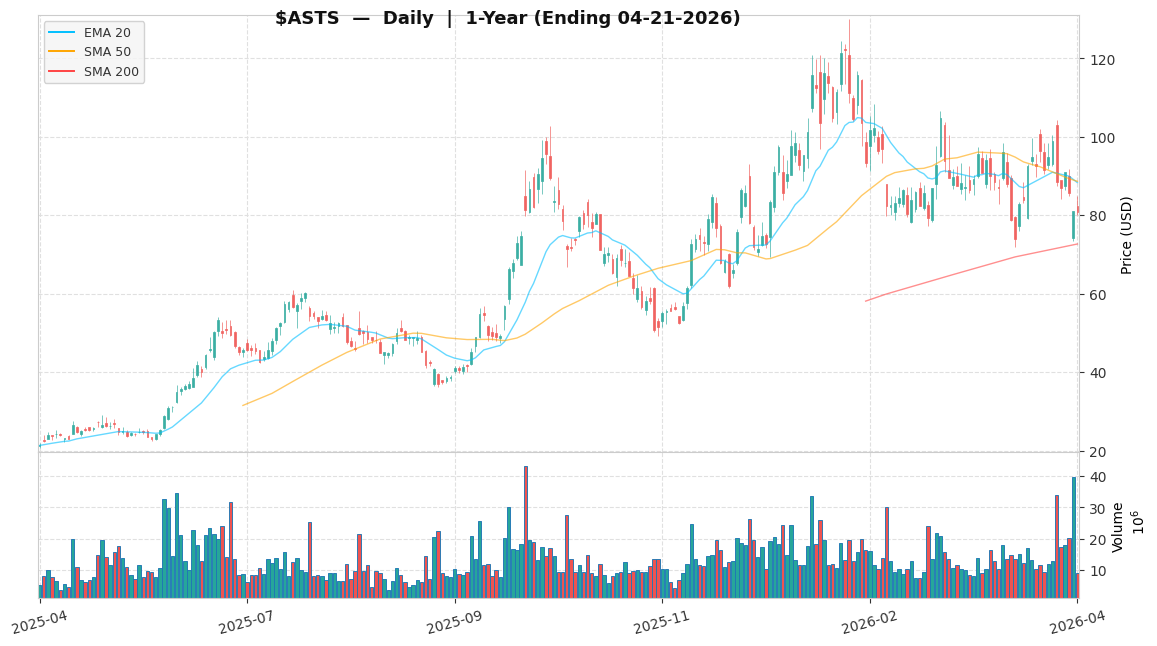
Second, the current market capitalization of $30.9B is facing pressure as investors weigh the immediate liquidity needs against a Forward EPS of -$0.15. Forward EPS (Earnings Per Share) is a forecast of a company’s potential earnings over a future period, and for a pre-revenue infrastructure firm like AST SpaceMobile, a negative figure indicates a high burn rate. The stock is currently trading at a Forward P/E of -536.14x, a figure that highlights the extreme speculative premium placed on future satellite-to-cell dominance. While the 52-week high of $129.89 showed what the market was willing to pay for optimism, the current $81.00 level reflects a reset to technical reality.
Core Growth Thesis
The core investment thesis for AST SpaceMobile remains anchored to its position as a first-mover in the direct-to-cell infrastructure market. Despite the Blue Origin setback, the fundamental value proposition—providing cellular broadband directly to unmodified handsets—remains a high-stakes infrastructure play. The primary driver for long-term value is the successful deployment of replacement satellites via SpaceX or corrected New Glenn flights. To reach commercial viability, the company must maintain a Launch Cadence of at least 4 satellites per quarter. This frequency is necessary to achieve the density required for continuous global service before current cash reserves are exhausted.
Furthermore, the strength of the thesis relies on non-dilutive capital inflows from Mobile Network Operator (MNO) partners. We are monitoring a threshold of $500M+ in MNO pre-payments as a key KPI (Key Performance Indicator). These payments from partners like AT&T and Verizon would serve as a critical indicator of commercial viability and partner confidence. If ASTS can secure these funds, it reduces the need for highly dilutive secondary equity offerings, which have historically pressured the stock price. The proprietary nature of their phased-array antenna technology provides a technical moat, but that moat is only valuable if the hardware is operational in Low Earth Orbit (LEO).
The Financial Reality
From a quantitative perspective, AST SpaceMobile’s financial profile is typical of a high-growth, high-risk space technology firm. The Forward P/E of -536.14x reflects a valuation that is entirely decoupled from current earnings and is instead a derivative of 2027 and 2028 projected cash flows. With a current price of $81.00, the market is pricing in a successful recovery from the recent launch failure, but the margin for error has narrowed significantly. The 52-week range of $20.68 to $129.89 illustrates the high Beta—a measure of a stock’s volatility in relation to the overall market—associated with this asset.
Liquidity management is the immediate concern. The company is navigating a critical execution window where technical failures could lead to a liquidity crisis. If the launch cadence does not normalize, the company may be forced into a strategic pivot, such as a distressed sale or a highly dilutive capital raise to fund operations. We analyze the valuation through a scenario-based lens because traditional metrics like ROIC (Return on Invested Capital) are not yet applicable to a company in the deployment phase; the most relevant forward multiples at this stage are EV/Revenue (forward) and Price/Sales (2027E). The current market cap of $30.9B requires a massive scale-up in the subscriber base to justify itself on a long-term discounted cash flow basis.
Scenario Analysis
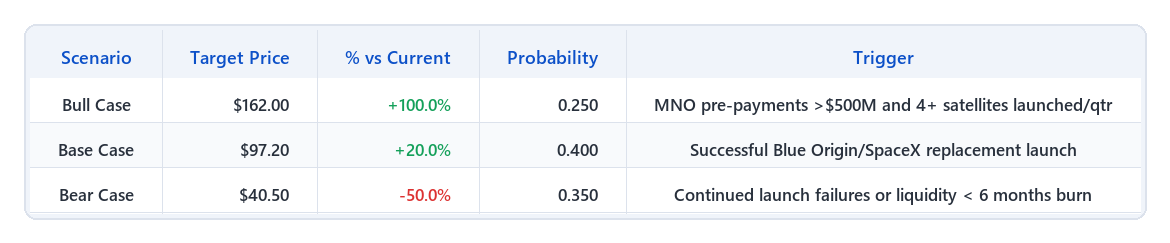
Our scenario-based price analysis for 2026 utilizes three distinct paths. The Base Case assumes a target of $97.20, representing a 20.0% upside from the current $81.00 price. This scenario, assigned a 40% probability, relies on a 1.2x multiple of our internal valuation model and assumes the company recovers from the Blue Origin setback by successfully deploying replacement satellites via SpaceX, enabling initial commercial revenue by late 2026. The Bull Case targets $162.00, a 100.0% upside, with a 25% probability. This assumes a 2.0x multiple driven by rapid constellation build-out, regulatory clearances in the US and EU, and MNO pre-payments exceeding the $500M threshold, which would effectively de-risk the balance sheet.
The Bear Case carries a 35% probability with a target of $40.50, representing a 50.0% decline. This scenario uses a 0.5x multiple and is triggered by persistent launch delays or technical failures on orbit. Such a scenario would likely lead to a liquidity crunch, forcing the company to seek capital at unfavorable terms, significantly diluting existing shareholders. When these scenarios are weighted by their respective probabilities, the Probability-Weighted Return (PWR) is approximately 15.5%. This calculation—(Base% × P_base) + (Bull% × P_bull) + (Bear% × P_bear)—where Bear% is expressed as a negative return: (+20% × 0.40) + (+100% × 0.25) + (-50% × 0.35) = 8% + 25% - 17.5% = ~15.5%. While the upside potential is significant, the 35% probability Bear scenario remains a heavy weight on the total return profile.
Actionable Strategy
Strategic Execution Rules: 1. Entry Protocol: Accumulation is statistically supported only if the company provides a definitive timeline for the next BlueBird launch within 60 days. Monitor the $81.00 level as a key technical support zone. Suggested position size: limit to 2–3% of portfolio given the elevated Beta and Bear Case target of $40.50. 2. Risk Management: A breach of the $70.00 level should trigger a re-evaluation of the Bear Case probability, as it may indicate institutional selling ahead of a potential capital raise. At the current stop-loss of $70.00 (a 13.6% drawdown from entry), a 2% portfolio allocation limits the portfolio-level loss to approximately 0.27%. 3. Exit Protocol: Consider profit-taking at the $97.20 Base Target if MNO pre-payments fail to materialize despite successful launches. Full exit is warranted if the launch cadence falls below 2 satellites per quarter over a six-month period.
Sources: - Bloomberg Terminal Data: current price, market cap ($30.9B), short interest (20% of float), 52-week high/low - SEC Filings (10-K/10-Q): cash position, operating cash flow, Forward EPS (-$0.15), equity dilution history - Blue Origin Mission Reports: New Glenn 3 anomaly details, BlueBird 7 loss confirmation - AST SpaceMobile Q4 2025 Financial Results: MNO partnership updates, constellation deployment roadmap
Disclaimer: This analysis is for informational purposes only and does not constitute personalized investment advice.
Key Institutional Risks
Launch Execution and Constellation Deployment Failure to maintain a minimum Launch Cadence of 4 satellites per quarter due to launch vehicle setbacks—such as the recent Blue Origin New Glenn anomaly—prevents the transition from beta testing to commercial revenue generation and threatens the 2026 revenue ramp thesis. MITIGATION: Diversify launch manifests across multiple providers including SpaceX and Blue Origin while maintaining comprehensive launch insurance to cover 100% of payload replacement costs.
Liquidity Shortfall and Equity Dilution If the cash runway falls below 6 months without achieving commercial service milestones, the firm faces a liquidity crisis requiring a highly dilutive capital raise at a valuation significantly below the current $30.9B market cap. MITIGATION: Prioritize securing non-dilutive financing through prepayments from strategic MNO partners like AT&T and Vodafone to extend the operational runway through the full constellation deployment.
Spectrum Interference and Regulatory Compliance Technical failure to maintain power flux density (PFD) within FCC-mandated limits or terrestrial interference claims could lead to a suspension of operating licenses, effectively halting service in key geographic markets. MITIGATION: Utilize dynamic beam-forming technology to minimize interference in contested zones and maintain a dedicated regulatory task force for real-time technical coordination with the ITU and FCC.
[MOD] OVERALL RISK RATING: MODERATE Rationale: Balanced risk/reward at current levels. Monitor KPI triggers closely before adding.
Next check-in: Q2 2026 earnings