
Apple's Strategic Pivot: Navigating Tariffs and AI Integration
Apple's premium market position is poised for re-evaluation as successful AI integration and new product categories must outpace escalating geopolitical...

Investment Highlights
Tariff costs accelerating: $3.3 billion absorbed (April-December 2025), annual run rate >$5 billion.
India manufacturing: 25% of iPhones produced, targeting majority US-bound from India by end of 2026.
Q1 2026 Revenue: $143.8 billion, up 16% YoY, with iPhone revenue up 23% YoY.
Probability-Weighted Return: ~7.4% upside based on scenario analysis.The primary catalyst for Apple Inc. ($AAPL) in the near term centers on the successful integration of advanced AI capabilities across its ecosystem and the market reception of new product categories like a foldable iPhone, alongside effective mitigation of its estimated $20 billion cumulative tariff exposure by the end of the decade. Management’s Q2 2026 guidance for 13%-16% YoY revenue growth and 48%-49% gross margin, as reported in the Q1 2026 earnings call, represents a critical near-term hurdle; our house view anticipates a slight upside surprise in services revenue growth (>18% YoY) which the Street currently undervalues, driven by accelerating subscription adoption and favorable regulatory outcomes in select non-US markets.
The Catalyst: Dissecting the News
The primary catalyst and price action context are summarized in the Investment Highlights above. See the Actionable Strategy section for scenario-based price targets and risk triggers.
Core Logic & Growth Drivers
Apple’s ($AAPL) core growth engine continues to be the iPhone, which drove an all-time record $85.3 billion in Q1 2026 revenue, up 23% year-over-year, largely in line with Street expectations for premium device upgrade cycles. The Services segment has emerged as a meaningful but volatile revenue driver; its contribution remains market-dependent, making quarter-to-quarter visibility limited, though we model a +150-200 basis point uplift to blended Services segment growth from accelerating subscription penetration and optimized ad monetization, leading to an estimated +1.5% top-line impact once fully scaled through FY2026. We estimate Services represents approximately 18% of total revenue at this stage, acting as a meaningful and increasingly profitable revenue driver — and a key catalyst for multiple re-rating as ecosystem monetization deepens through FY2026. Near-term CapEx is primarily directed towards R&D for AI integration and supply chain diversification into India, a strategic investment expected to yield structural margin benefits by late 2026, though we project a near-term 50-75 basis point drag on operating margins in FY2025-2026, defended by the company’s robust $111.48 billion in operating cash flow (TTM). The company faces persistent competitive challenges from Samsung and Google in the premium smartphone market, particularly with Android’s increasing AI capabilities, while its App Store continues to be a battleground against regulatory bodies globally, which could force commission reductions, as seen with ongoing antitrust lawsuits. Our long-term growth thesis would be materially impaired if Services Revenue Growth is sustained below 18% YoY for two consecutive quarters due to macro headwinds or regulatory actions, signaling a fundamental weakening of ecosystem monetization.
The Financial Reality
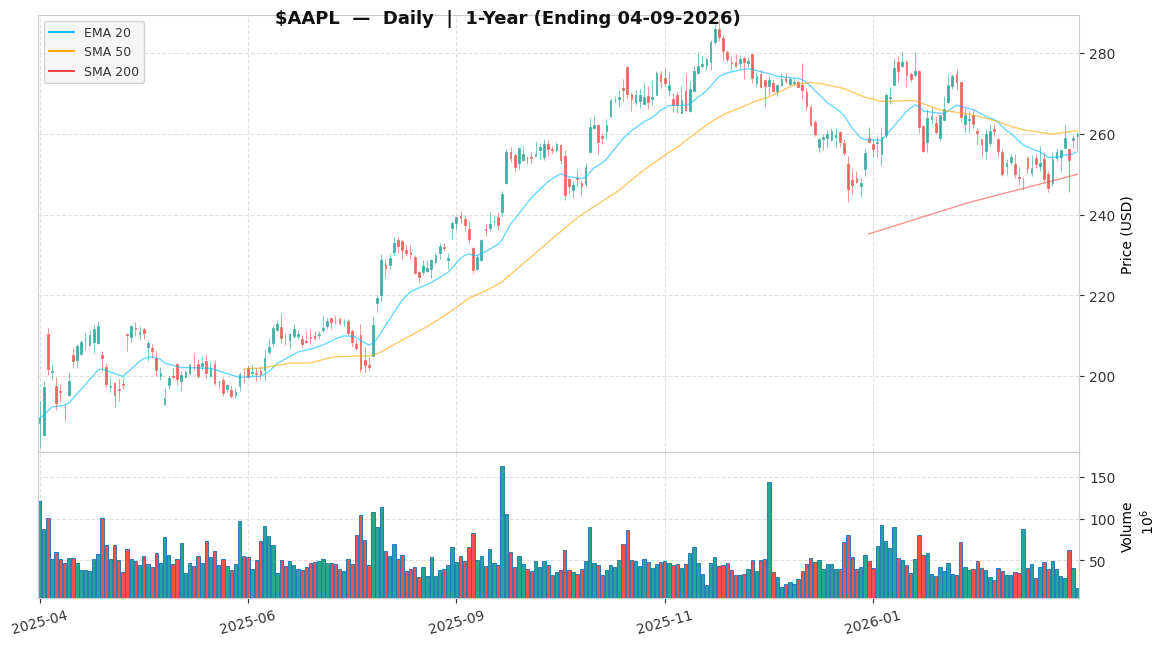
Apple Inc. ($AAPL) is priced at $260.1 as of recent trading, approximately 9.87% below its 52-week high of $288.62 and 53.48% above its 52-week low of $169.21. At 27.89x forward earnings, Apple trades at a premium to legacy hardware peers (which typically trade at ~15x–22x), yet at a discount to pure-play high-growth AI software peers (which command ~35x–50x), reflecting the market’s mixed view on its transformation narrative but potential for multiple expansion if AI monetization accelerates. On a DCF/FCF yield basis, Apple generates a strong ~2.92% (Operating Cash Flow $111.48B / Market Cap $3.82T), above the technology sector median; however, mapping the strategic CapEx for supply chain diversification and AI infrastructure implies a 2-3 year investment recovery timeline, creating a near-term FCF drag not fully captured by the 27.89x P/E. We model an 8% top-line CAGR, with a 70/30 mix shifting toward higher-margin services and AI-driven hardware, diluting near-term FCF by 100bps due to AI CapEx, but structurally expanding operating margins to 28-29% by 2027, further supported by the company’s elevated but serviceable financial leverage with a Debt/Equity ratio of 102.63%.
Actionable Strategy
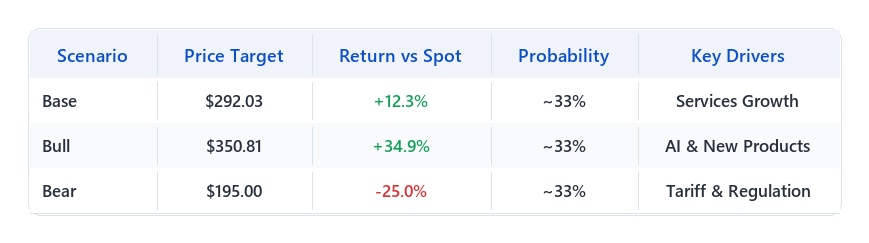
| Bear | $195.00 | -25.0% | ~33% | Tariff & Regulation |We assign Apple Inc. ($AAPL) an “Accumulate (Selective)” rating for the next 12-18 months, reflecting a patient approach to building exposure in a high-quality name amidst evolving macro and regulatory dynamics. This is a selective core position; we recommend a maximum 3% portfolio weight, initiating a 1/3 starter position now and adding only on pullbacks to the 50-day moving average or the $245–$250 range, keeping sizing strict until the Services segment demonstrates sustained growth above 18% YoY. With a 33% probability assigned to the Base case, 33% to the Bull case, and 33% to the Bear case, the probability-weighted expected return is approximately ~7.4% (= +12.3% × 33% + 34.9% × 33% − 25.0% × 33%), proving the asymmetric upside skew. The 33% probability for each scenario is anchored to a balanced assessment of both company-specific execution and broader market uncertainties, providing a transparent framework for our return expectations. Our Base Case target is $292.03, derived from a 31.3x P/E multiple on NTM EPS of $9.3300 per FactSet consensus as of 2026-04-09, representing a +12.3% move from current levels. The current 27.89x reflects persistent geopolitical trade tensions and ongoing regulatory scrutiny on the App Store, compressing the multiple below its historical average of approximately 30x; a successful diversification of the supply chain to India and favorable resolution of key regulatory challenges would resolve this overhang, justifying re-rating toward the 31.3x base target. Our Bull Case target is $350.81, applying 37.6x to an expanded EPS estimate (assuming Services segment growth consistently exceeds 18% YoY and new product categories gain substantial traction), suggesting a +34.9% move from current levels if Apple successfully integrates advanced AI across its product ecosystem and launches a highly anticipated foldable iPhone. Our Bear Case target is $195.00, applying a compressed 20.9x multiple, indicating a -25.0% downside from the current price if Services Revenue Growth is sustained below 18% YoY for two consecutive quarters due to macro headwinds, at which point we would re-evaluate the position for a potential reduction. The key operational KPIs we will monitor to track this thesis: Services Revenue Growth (requiring sustained growth >18% because it indicates successful ecosystem monetization beyond hardware dependency) and Gross Margin (where any print below 47% would invalidate our multiple-expansion thesis because it signals significant pressure from tariffs or supply chain costs). One tail risk worth flagging: a broad sector-level de-rating of Technology — driven by macro regime shifts, policy headwinds, or investor rotation — could compress AAPL’s multiple independent of its fundamental progress, a reminder that even a well-executed thesis can be temporarily overwhelmed by sentiment-driven valuation compression. In a broad sector de-rating scenario, we would prioritize HOLDING; however, strong exit triggers include Services revenue growth falling below 15%, or valuation overextending beyond 35x P/E without corresponding margin expansion. Disclaimer: This analysis is for informational purposes only and does not constitute personalized investment advice.
🛡️ Key Institutional Risks
Geopolitical Trade Tensions Escalating trade disputes, particularly between the US and China, could lead to increased tariffs on Apple’s products, impacting production costs and consumer pricing, potentially causing quarterly gross margins to fall below 45% for two consecutive quarters. MITIGATION: Monitor Apple’s supply chain diversification efforts, specifically the progress of shifting US-bound production to India, and track quarterly gross margin trends for sustained compression.
App Store Regulatory Risk Ongoing antitrust lawsuits and potential new regulations could force Apple to significantly reduce its App Store commissions, particularly if a ruling mandates rates below 15% for external payments, materially impacting the highly profitable services segment. MITIGATION: Closely monitor legal and regulatory developments, especially any Supreme Court rulings or legislative actions, and assess their potential impact on Apple’s services revenue growth and profit margins.
Innovation & Product Failure Failure of new product categories (e.g., Vision Pro, foldable iPhone) to achieve significant market adoption or a slowdown in core product innovation could lead to market share loss and decelerated revenue growth, potentially causing YoY revenue growth to drop below 5% for two consecutive quarters. MITIGATION: Track market reception and sales data for new product launches, monitor competitor innovation, and assess Apple’s overall revenue growth trajectory against analyst consensus and historical performance.
🟡 OVERALL RISK RATING: MODERATE
📅 Next check-in: Q2 2026 earnings